Python卡方檢驗
卡方檢驗是確定兩個分類變量是否具有顯着相關性的統計方法。 這兩個變量應該來自相同的人口,他們應該是類似的 - 是/否,男/女,紅/綠等。例如,我們可以建立一個數據集,觀察人們的冰淇淋購買模式並嘗試關聯 - 他們喜歡的冰淇淋味道的人的性別。 如果發現相關性,我們可以通過了解訪問人羣的性別數量來計劃適當的口味。
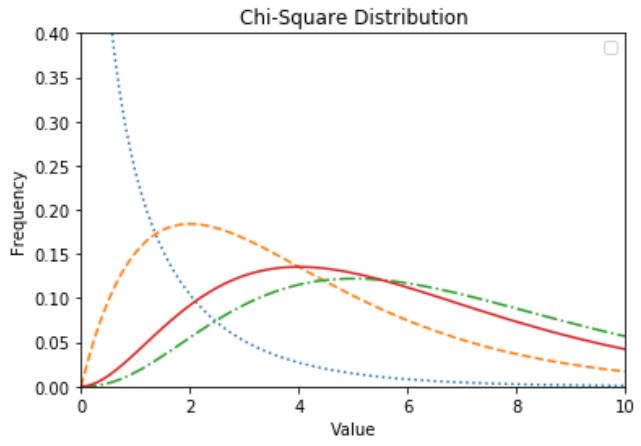
在numpy庫中使用各種功能來執行卡方檢驗。
from scipy import stats
import numpy as np
import matplotlib.pyplot as plt

x = np.linspace(0, 10, 100)
fig,ax = plt.subplots(1,1)

linestyles = [':', '--', '-.', '-']
deg_of_freedom = [1, 4, 7, 6]
for df, ls in zip(deg_of_freedom, linestyles):
  ax.plot(x, stats.chi2.pdf(x, df), linestyle=ls)

plt.xlim(0, 10)
plt.ylim(0, 0.4)

plt.xlabel('Value')
plt.ylabel('Frequency')
plt.title('Chi-Square Distribution')

plt.legend()
plt.show()
執行上面示例代碼,得到以下結果 -