Python氣泡圖
氣泡圖將數據顯示爲一組圓圈。 創建氣泡圖所需的數據需要具有xy座標,氣泡大小和氣泡顏色。 顏色可以由庫自己提供。
繪製氣泡圖
氣泡圖可以使用DataFrame.plot.scatter()方法來創建。
import matplotlib.pyplot as plt
import numpy as np
# create data
x = np.random.rand(40)
y = np.random.rand(40)
z = np.random.rand(40)
colors = np.random.rand(40)
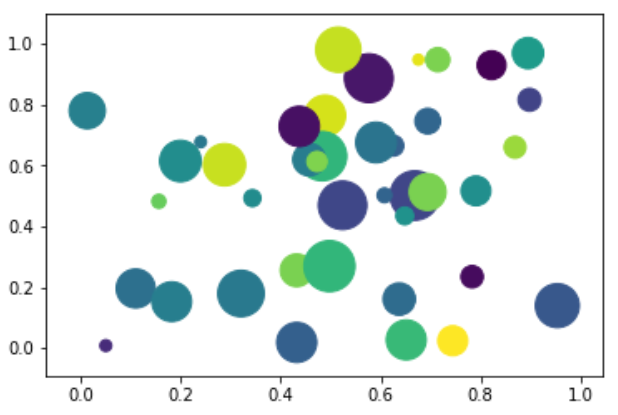
# use the scatter function
plt.scatter(x, y, s=z*1000,c=colors)
plt.show()執行上面示例代碼,得到以下結果 -