NumPy使用 Matplotlib 繪製直方圖
NumPy - 使用 Matplotlib 繪製直方圖
NumPy 有一個numpy.histogram()函數,它是數據的頻率分佈的圖形表示。 水平尺寸相等的矩形對應於類間隔,稱爲bin,變量height對應於頻率。
numpy.histogram()
numpy.histogram()函數將輸入數組和bin作爲兩個參數。 bin數組中的連續元素用作每個bin的邊界。
import numpy as np

a = np.array([22,87,5,43,56,73,55,54,11,20,51,5,79,31,27]) ]
np.histogram(a,bins =  [0,20,40,60,80,100])
hist,bins = np.histogram(a,bins =  [0,20,40,60,80,100])
print hist
print bins
輸出如下:
[3 4 5 2 1]
[0 20 40 60 80 100]
plt()
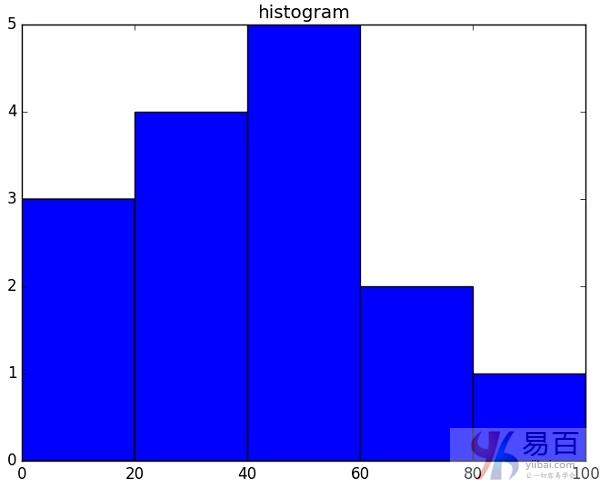
Matplotlib 可以將直方圖的數字表示轉換爲圖形。 pyplot子模塊的plt()函數將包含數據和bin數組的數組作爲參數,並轉換爲直方圖。
from matplotlib import pyplot as plt
import numpy as np

a = np.array([22,87,5,43,56,73,55,54,11,20,51,5,79,31,27])
plt.hist(a, bins =  [0,20,40,60,80,100])
plt.title("histogram")
plt.show()
輸出如下: